
Motivation
Data pipelines have the potential to produce unexpected results in a variety of ways. Anomalous data can cause data to be scaled incorrectly. Machine learning model drift can lead to reduced prediction accuracy. Failures in the upstream collection could cause null values as the data pipeline executes. How do we safeguard against these failure cases?
One way to monitor the data quality is data validation. Tools such as Pandera and Great Expectations allow data practitioners to establish a pre-defined set of rules. For example, we can check the existence of columns in a dataset or if an important feature contains null values.
Though this sounds good in theory, it requires us to know many things about the data beforehand. Great Expectations does have a profiler, but it’s quite strict and does not scale to Spark well. When our data is less predictable, we need to find other ways or metrics to alert us of degradation over time. For example, think of a time series trending upwards that drops significantly one day. If we applied data validation to check the maximum and minimum values, our validation rules may not catch this drop. We need a more general set of profiling tools that can extend to applications like data validation, drift detection, and anomaly detection.
Introducing whylogs
This is where whylogs comes in. whylogs is an open-source data logging framework that lets us profile our data with minimal overhead. The problems mentioned above: anomaly detection, drift detection, and data quality checks can all be addressed if we have good profiles on our data.
With whylogs, users can profile their data by adding a few lines of code. Take the following example where we profile a Pandas DataFrame.
python 1import pandas as pd
 2data = {
 3    "animal": ["cat", "hawk", "snake", "cat"],
 4    "legs": [4, 2, 0, 4],
 5    "weight": [4.3, 1.8, 1.3, 4.1],
 6}
 7
 8df = pd.DataFrame(data)
 9
10import whylogs as why
11
12profile = why.log(df).profile()
The profile can be viewed to produce something like the table below.
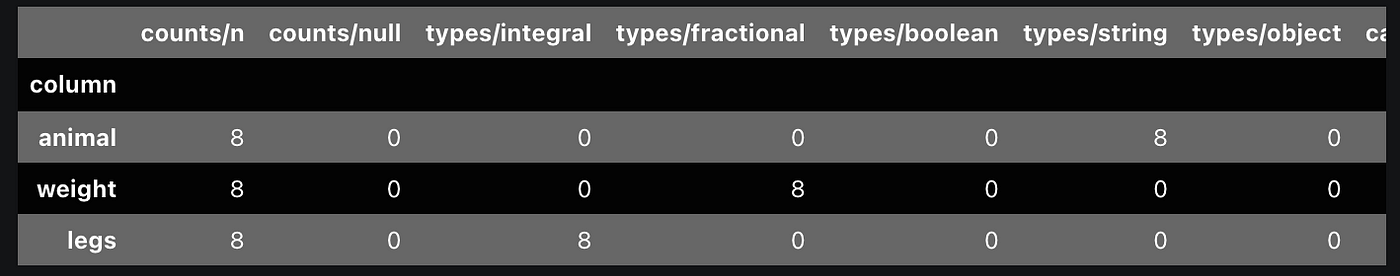
The profile contains more columns than can be displayed here elegantly. In the image above, we see (in order):
- total record count (first column)
- null record count (second column)
- inferred types of the values in the column (third to seventh columns)
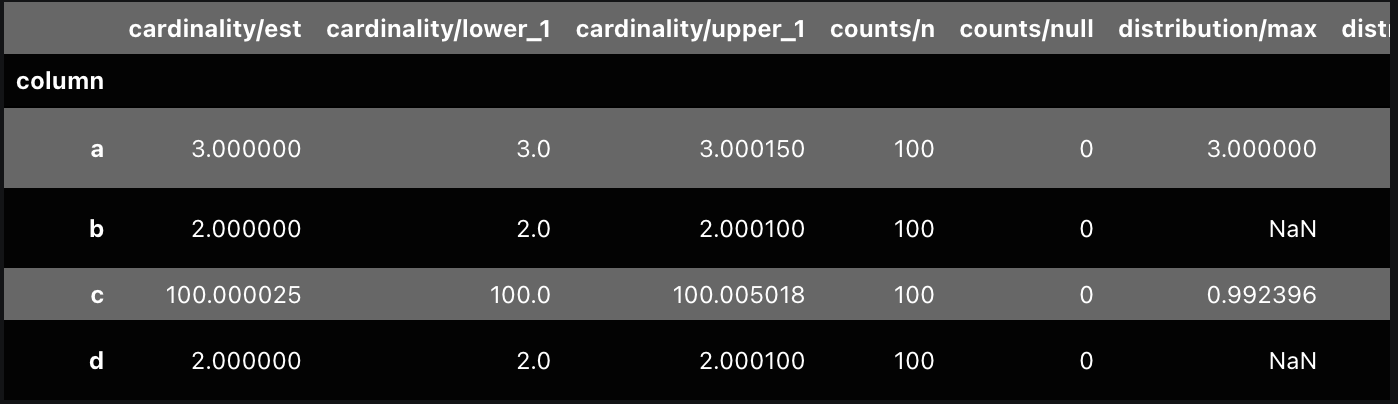
Other columns that did not fit in the image above include:
- estimated cardinality
- frequent values
- distribution metrics such as max, min, and quantiles
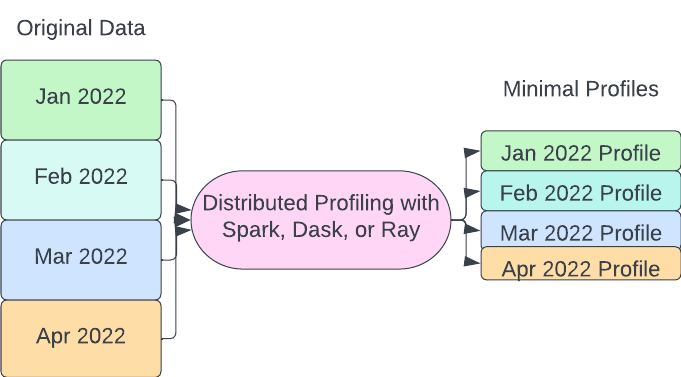
whylogs profile design has three important properties: efficient, customizable, and mergeable. The first two are pretty self-explanatory. whylogs has a low overhead, allowing it to easily scale to big data frameworks such as Spark. The more important property is the mergability. Profiles of smaller pieces of a DataFrame can be added together to form a global dataset profile.
This is an important property when dealing with distributed frameworks such as Spark, Dask, and Ray where the data can live across multiple workers. The partitions can be profiled independently and then rolled up. The second thing is that more important subsections of datasets can also be profiled independently if needed and then rolled into a broader profile without having to recompute statistics such as quantiles.
Scaling to Big Data with Fugue
Some libraries profile data such as pandas-profiling, but these are focused on exploratory data analysis, so they are designed to track different things. Some of the information pandas-profiling provides is harder to scale to big data frameworks like Spark.
whylogs is designed to scale its data logging to big data. We can use the Fugue integration to run the profiling distributedly. They also have integrations with Kafka and Feast among others.
The open-source Fugue project takes Python, Pandas, or SQL code and brings it to Spark, Dask, or Ray. Using whylogs on top of Fugue allows us to maintain the same simple interface to generate profiles. For example:
python1from whylogs.api.fugue import fugue_profile
2
3fugue_profile(pandas_df).to_pandas()
This is still running on the top of Pandas engine. It will yield the same result as the code snippet above using plain whylogs. The advantage is that we can bring it to Spark, Dask, or Ray just by supplying one parameter.
To bring it to Spark, we can pass in a SparkSession as the engine.
python1
2from whylogs.api.fugue import fugue_profile
3from pyspark.sql import SparkSession
4
5spark = SparkSession.builder.getOrCreate()
6fugue_profile(spark_df, engine=spark)
To execute on Dask and Ray, we can pass the cluster address or the Client.
Profiling Logical Partitions
When dealing with big data, one of the more common use cases is profiling the logical partitions of the data. This can help us find outlier partitions and can be useful for exploratory analysis also.
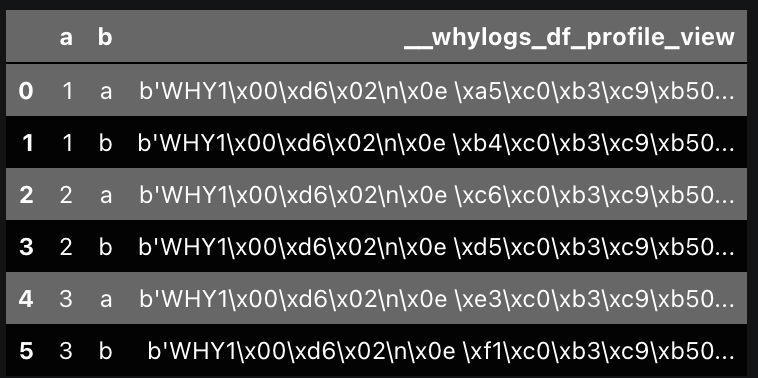
python1fugue_profile(spark_df, partition={"by":["a","b"]}, engine=spark_session)
This will return an output like the image below where the last column is a serialized profile. These can then be deserialized and post-processed. This DataFrame is already significantly smaller than the original DataFrame, so deserialization and extracting data is pretty fast. Operating on the profiles allows us to store and analyze a significantly smaller volume of data.
The Use of Data Profiles
With data profiles in place, we can apply them to different use cases.
Anomaly Detection
For new data that consistently comes in monthly, we could run the profile every month and store these profiles. We can then compare values at the different quantiles across the profiles with metrics such as z-score.
This setup is especially important with big data because we don’t need to return to previous data and recompute metrics. The data profile can be sufficient for checking for anomalies.
Data Quality
There is a missing data count included in the profiles. Cardinality can also help when looking for columns with more categories than there should be. We can also check if the numbers are within a certain known range with the already included quantiles. Custom metrics can also be added if there are any more things that users need to track.
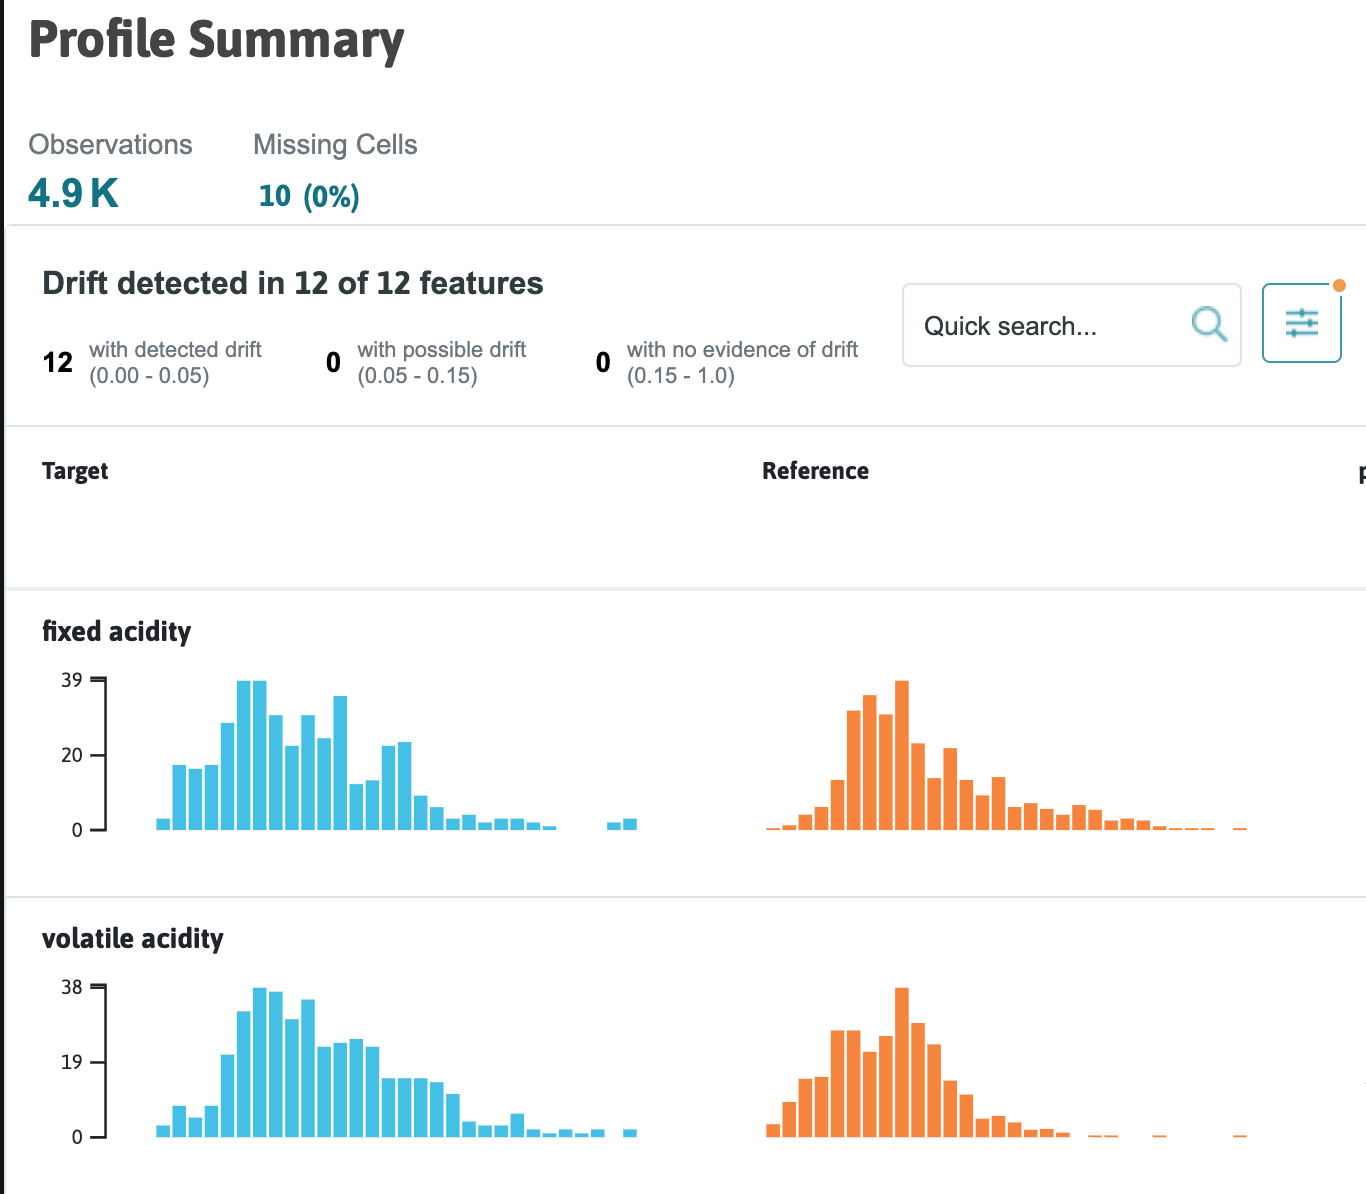
Drift Detection
We can determine if we need to retrain our machine learning model by monitoring the distributions of the data coming in. With a few additional lines of code, whylogs can generate visualization reports. These are very helpful when debugging why an unexpected distribution of predictions is happening. The image below shows the expected distributions versus the actual distributions of the new data.
Conclusion
In this article, we talked about a family of problems that can be solved with data profiling. Anomaly detection, drift detection, and data quality problems sometimes need to be tackled without prior knowledge of the data. Data profiles are a very general approach to handling these in an unsupervised manner. Profiles can also be the basis for validation rules in the future.
whylogs is especially powerful because it is designed to be lightweight and scale to big data. The mergability property also allows it to be used in a distributed setting on the partitions of data, which can be combined later. Using the Fugue integration, whylogs can be used on top of Spark, Dask, and Ray easily to run profiling on top of a cluster. These results can then be saved and used in the future without recomputing past data.
Resources
To chat with us: